Helping Seattle move

Usability Study for Seattle Department of Transportation's website: Seattletraffic.gov

This project was undertaken at the behest of the Seattle Department of Transportation (SDOT). For a period of two to five years, Seattle will be experiencing a series of construction projects aimed at easing traffic and improving various parts of the city. However, during this time, traffic will be constricted and is expected to worsen, for the purposes of this study, it will be called as the Seattle Squeeze.

In anticipation, SDOT has rolled out a new website, www.seattletraffic.org. The objective of this website is to provide users with commute information that can aid them in changing their behavior to improve not only their commute, but the commutes of everyone in the region. The aim of this study is to determine how effective this website is in conveying the required information to users in order to give them the tools to ease their commutes, especially through downtown.
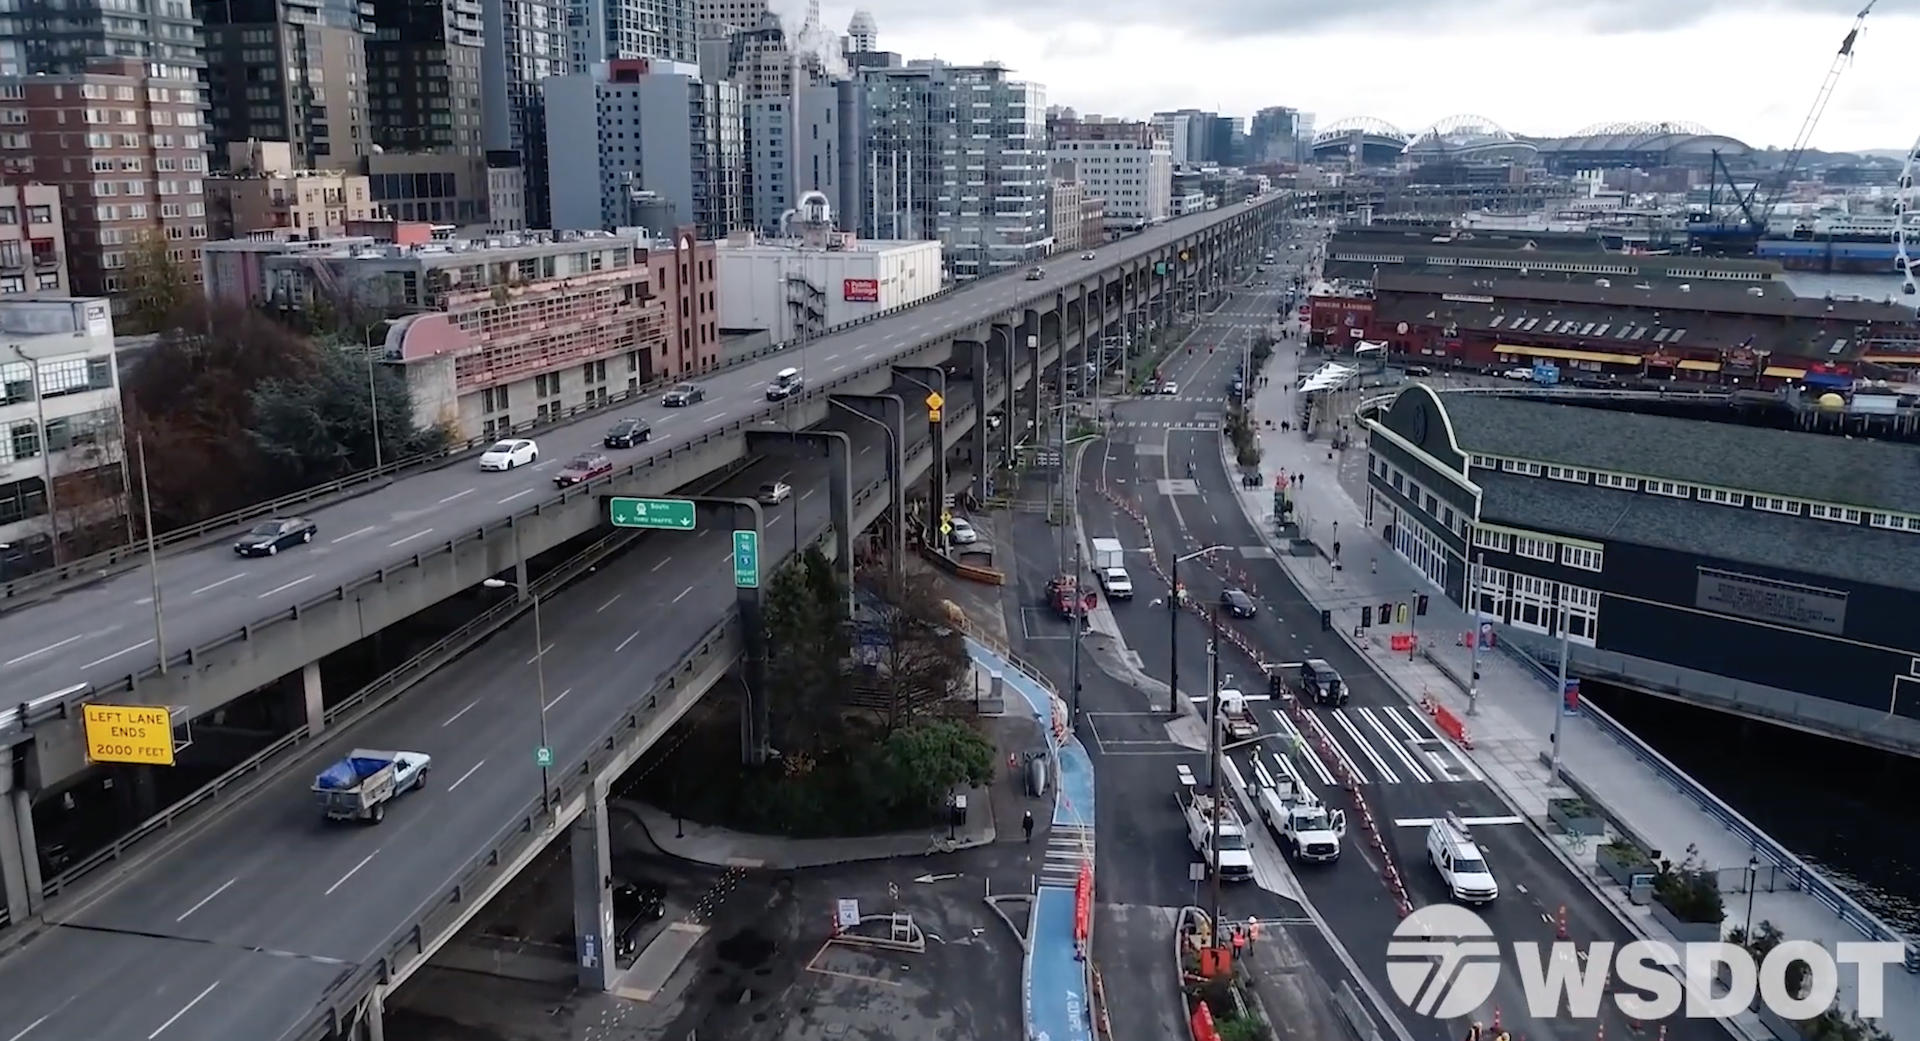
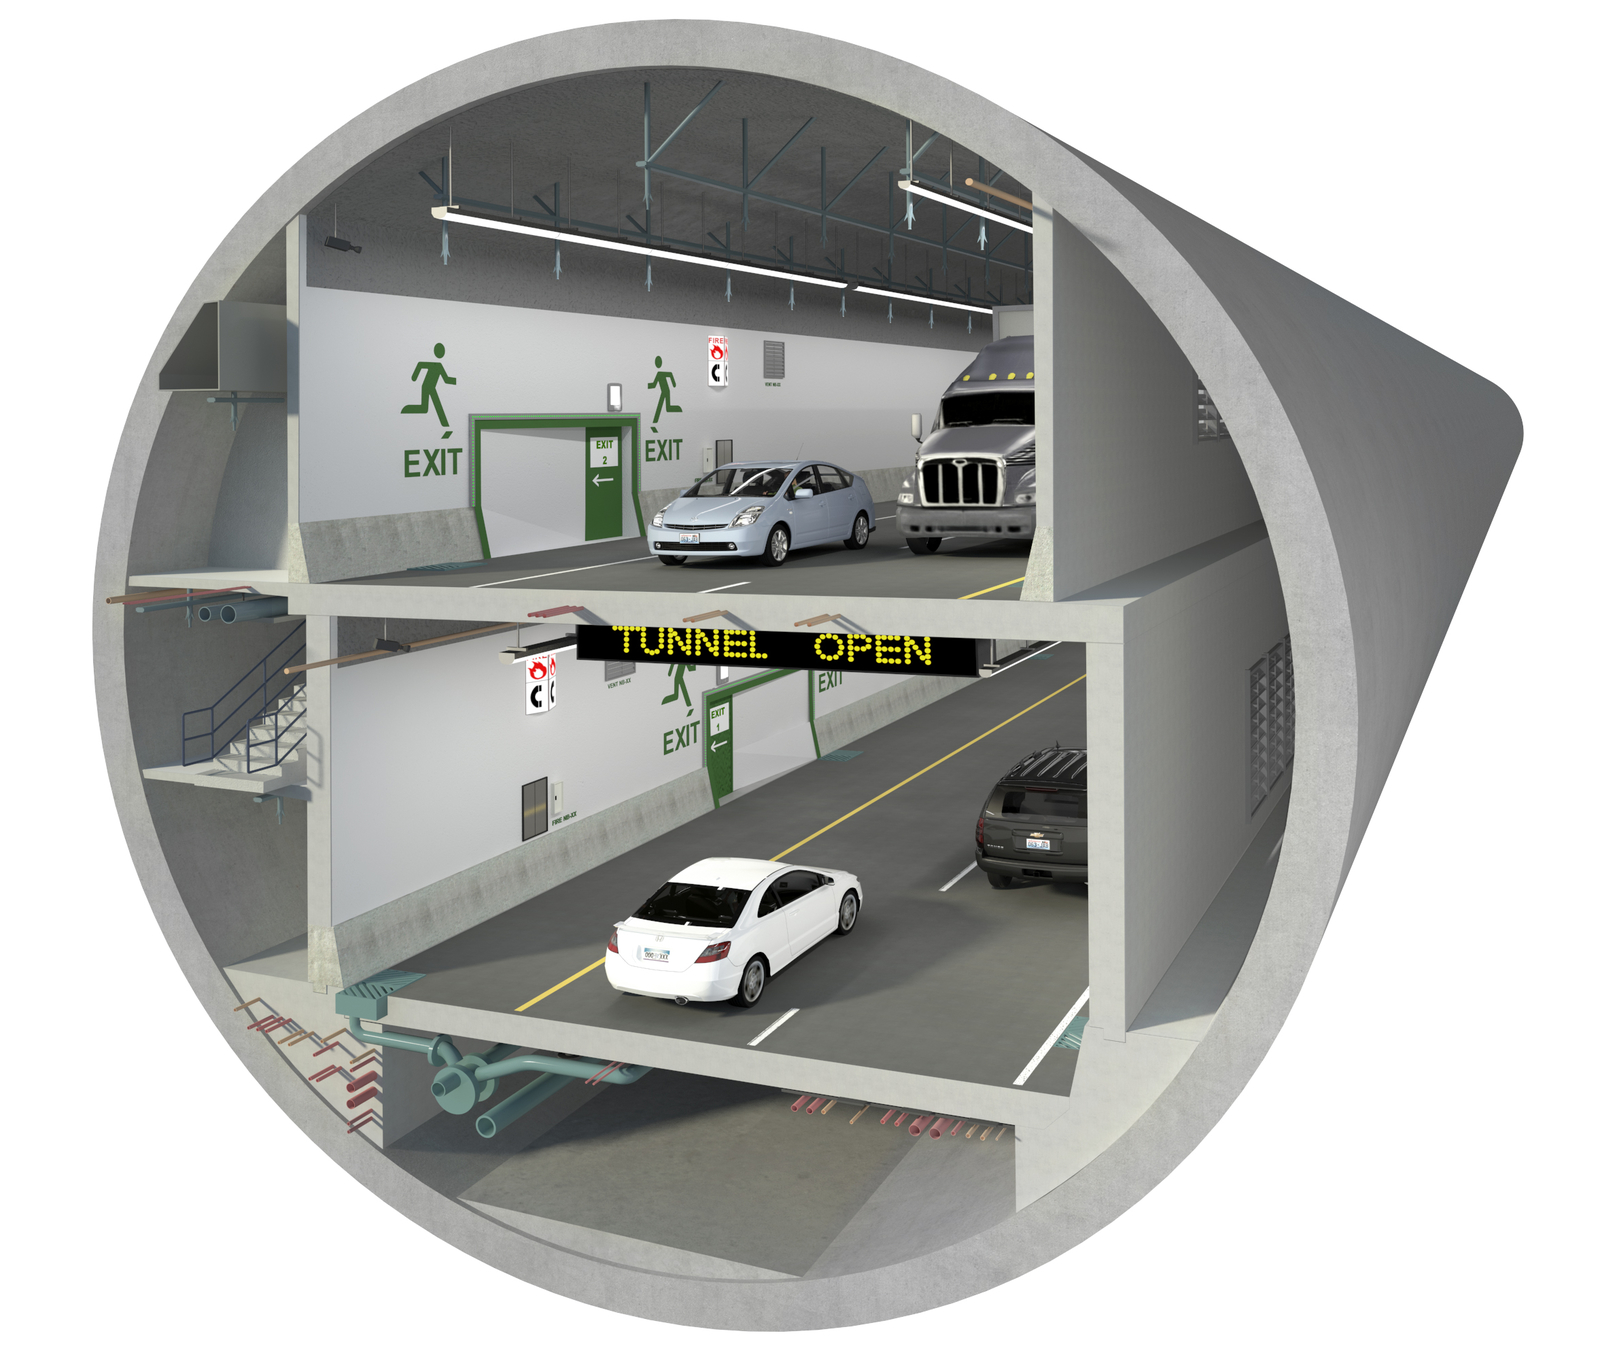
The Alaskan Way viaduct on the left and its replacement SR99 Tunnel on the right.

Research Questions

SDOT stated that the purpose of this website is twofold: first, to inform the public of upcoming changes to traffic patterns in the region; and second, to encourage commuters to change their behavior to decrease the number of vehicles on the road. Our goal as researchers was to assess whether or not the website is successful in achieving these goals. To that end, we developed the following research questions:

  • Are downtown commuters able to easily locate and access the transit planning information they need on the website?

  • Are the tools and information presented on the website enough of a catalyst to help commuters change their commuting behavior?

  • Are participants willing to make the switch to new tools, if those tools would ease their travel?

  • What expectations do participants have for a website that purports to contain this type of information?

  • Is the website easily accessed and navigated on mobile platforms?

Participants and recruitment

SDOT identified their target demographic as anyone who commutes to or through downtown Seattle at least once a week. We further refined this to the following three exclusionary traits: must be over the age of 18, participants must commute to or through downtown Seattle at least once a week, and participants must own a smartphone.

Selected Participants

07

Total Responses

121


Participant 1: Early 20's; Uses bus and carpool.

Travels for 5-6 days/week with an average of 45 minutes spent on traveling. Low awareness of 'Seattle Squeeze'

Participant 2: Late 20's; Uses bus and bicycle.

Travels for 5-6 days/week with 30-40 minutes spent on traveling. Moderate awareness of 'Seattle Squeeze'

Participant 3: Early 20's; Uses bus and carpool.

Travels for 5-6 days/week with 30-40 minutes spent on traveling. Low awareness of 'Seattle Squeeze'

Participant 4: Early 60's; Uses bus or light rail and bikes for traveling to bus/train stops.

Travels for 5 days/week with an average of 1 hour 45 minutes spent on traveling. High awareness of 'Seattle Squeeze'

Participant 5: Early 40's; Uses bicycle, car, and train.

Travels for 5 days/week with an average of 2 hours spent on traveling. Moderate awareness of 'Seattle Squeeze'

Participant 6: Early 30's; Uses bus and bicycle.

Travels for 5-6 days/week with an average of 2 hours spent on traveling. High awareness of 'Seattle Squeeze'

Participant 7: Early 20's; Uses bus.

Travels for 5 days/week with an average 45 minutes spent on traveling. Low awareness of 'Seattle Squeeze'

Task List

  • Task 1: Explore the website

    We asked participants to take a few minutes and lightly skim through the material on as many pages as possible. This allowed us to address research questions regarding user expectations versus reality, as well as determine ease of access on a mobile device.

  • Task 2: Locate resources that can identify issues related to your current commute

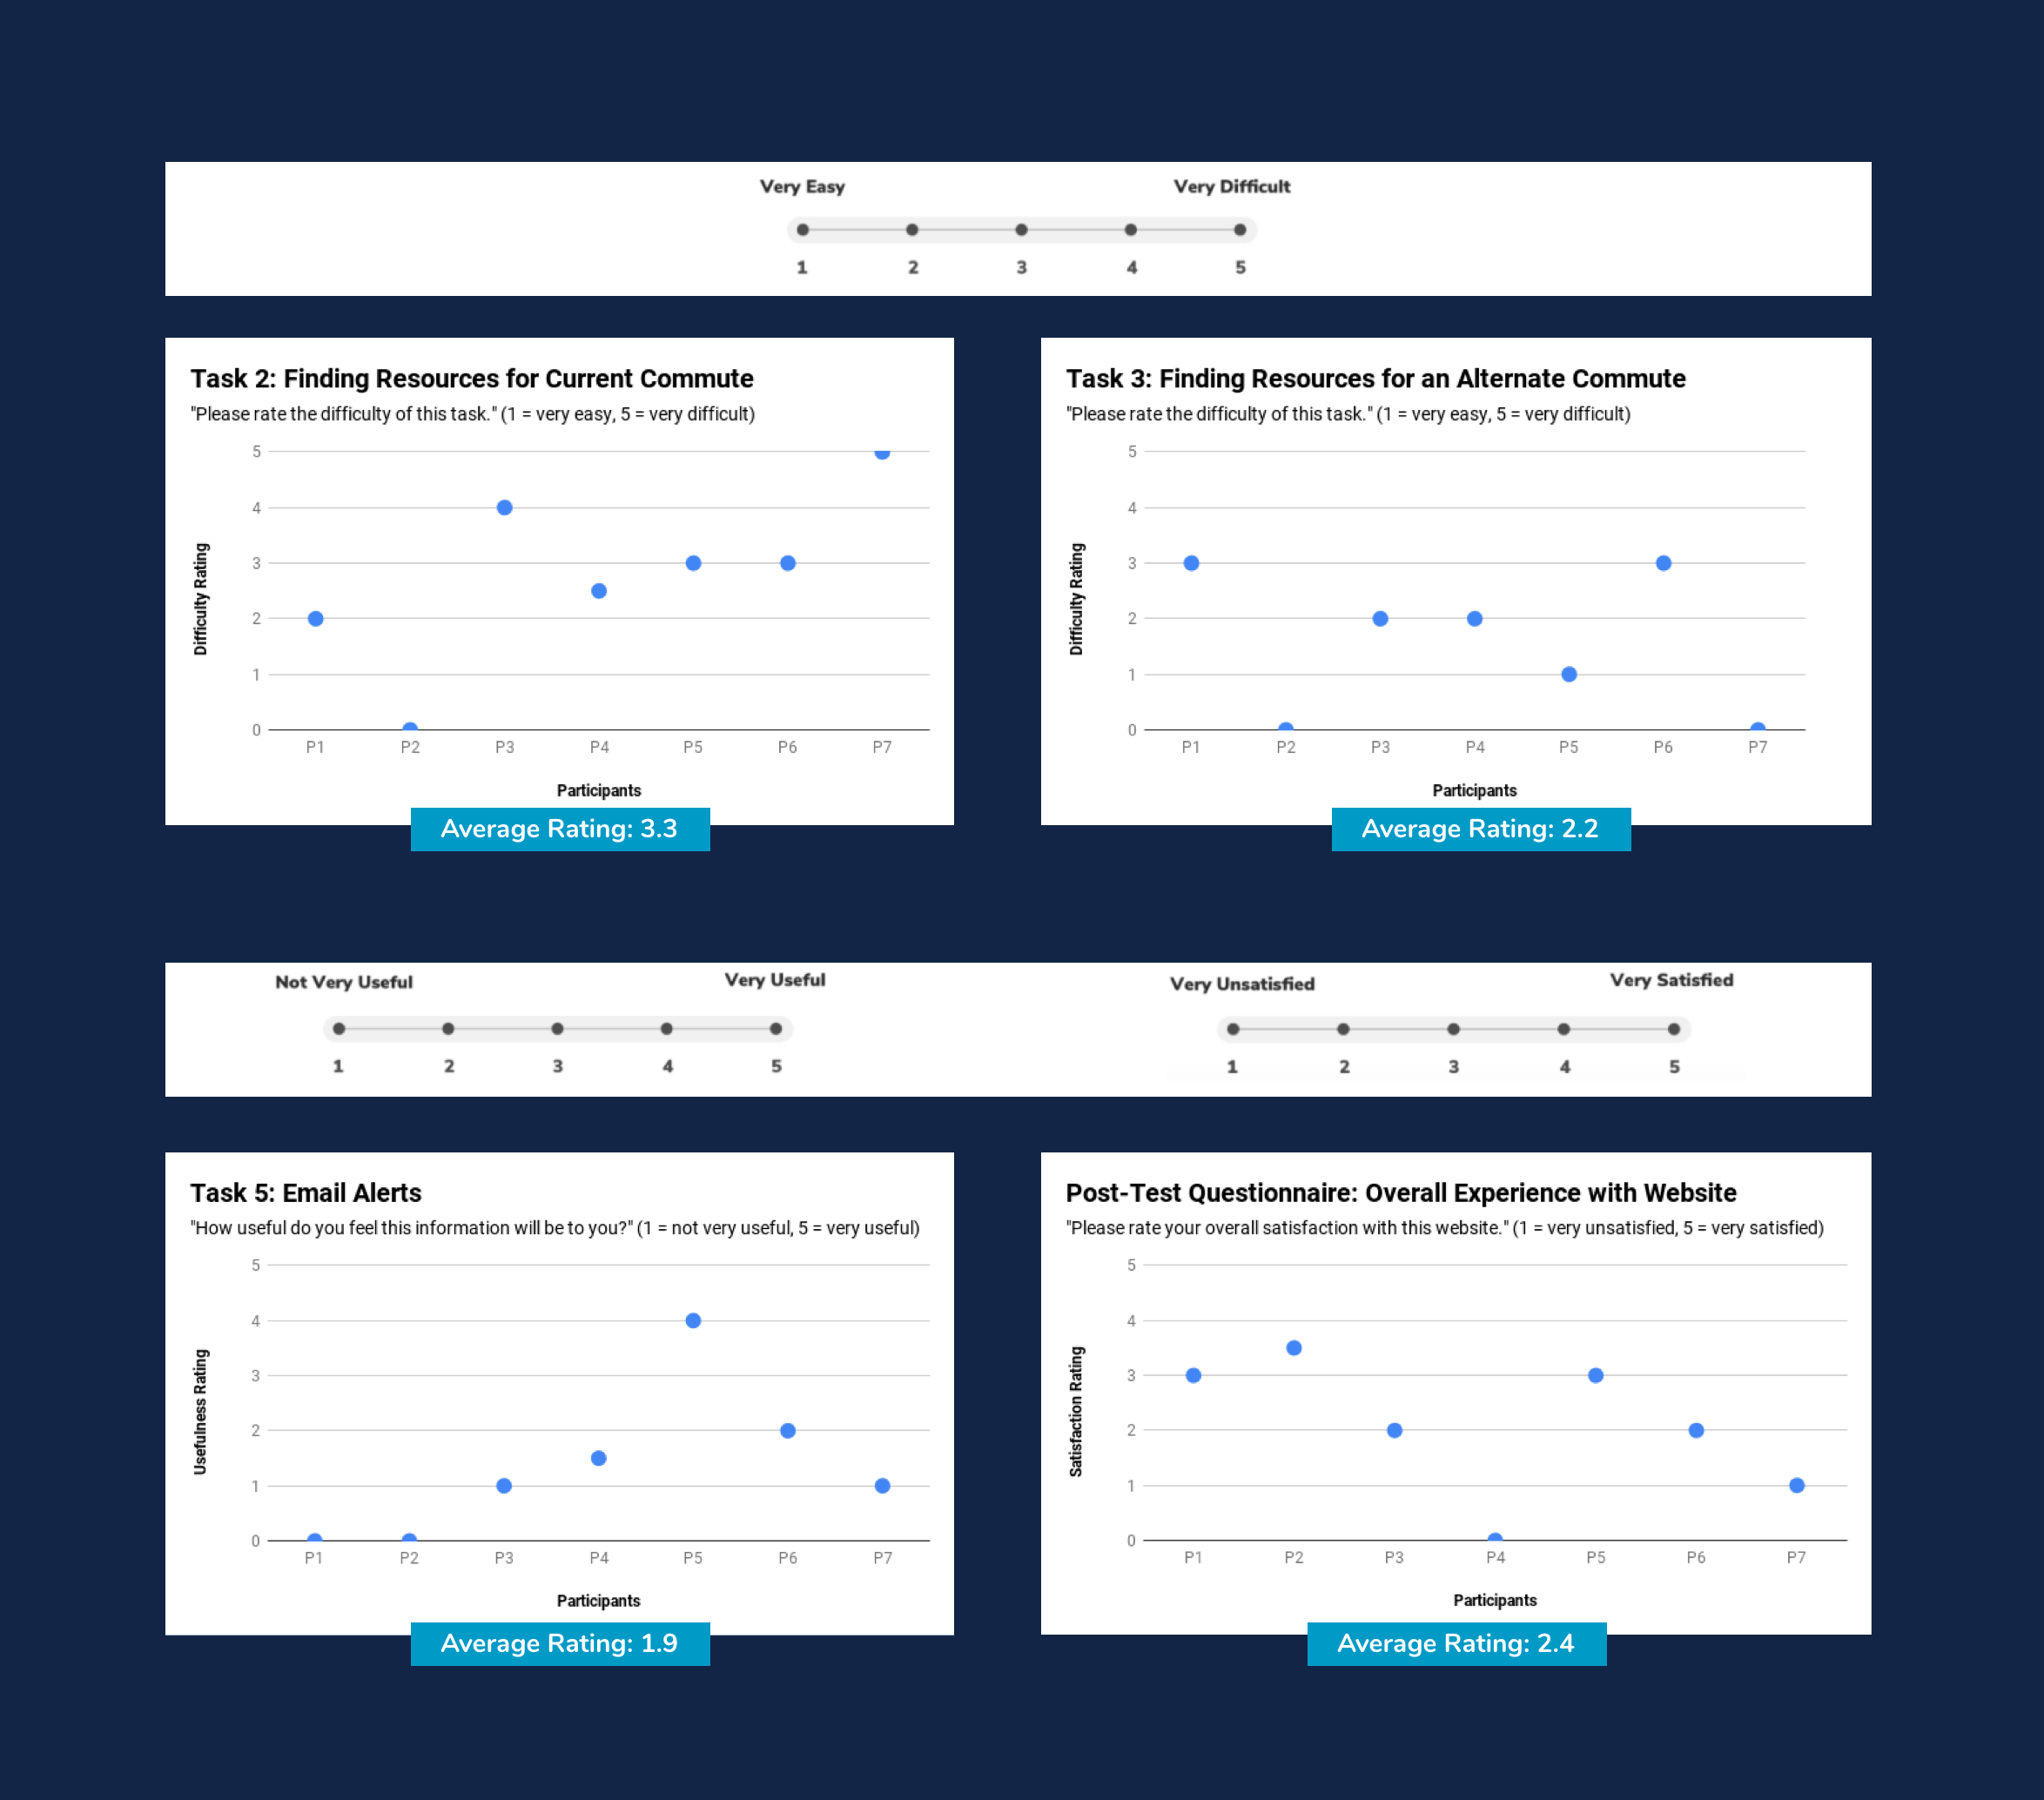
    Participants were tasked with locating up to three tools that could help notify them of potential issues that might require them to make short-term changes to their commuting behavior. Through this, we were able to assess research questions about the ease of locating transit planning information and whether or not participants were willing to switch to new tools that might improve their commuting experience.

  • Task 3: Locate resources to plan an alternative commute

    While the previous task was designed to assess short-term behavioral changes, this task sought to evaluate the capability of participants to make long-term commuting changes using the site. The research questions addressed here are the same as those of the previous task.

  • Task 4: Assess the usefulness of the Traveler’s Map and the Projects & Construction Map

    Our focus when moderating this task was the ease of navigation on a mobile platform and participants’ willingness to adopt these maps as part of their personal information streams.

  • Task 5: Locate one or more sources of daily traffic updates and sign up for them

    Here, participants were tasked with signing up for email alerts through the website, with additional success measured through finding the aggregated Twitter feeds. This addressed whether or not this key capability was easily accessed via mobile and whether participants would adopt this tool.


Facilitation

In person interviews

We met with all participants in person in a quiet testing environment. We used the Zoom app to capture the participants’ smartphone screen and to record audio. We had two backup cameras as well, in case one recording vector was lost or corrupted. Participants were asked to employ think-aloud protocol to walk us through their decision-making process. Participants were orally administered a pre- and post- test questionnaire (see appendix), as well as post-task questionnaires for each of the five tasks. Each task also had a series of follow-up questions, employed only if the moderator felt the user had not addressed particular points of interest in their attempt to complete the task. Average testing time was about one hour.

Note taking

Notetakers followed along with a pre-constructed task sheet, with only one notetaker present in the room with the moderator and the participant, and one to two notetakers in another room listening in. We arranged ourselves this way for two reasons: to check the levels of the recording and to put the participant at ease by reducing the number of people in the room with them. Finally, participants were compensated in the form of a $25 Amazon gift card provided by SDOT.

Findings and Recommendations

Severity Scale

Prevents completion of a task

Necessary to fix

Creates significant delay and frustration

High priority to fix

Minor usability problem

Low priority to fix

Homepage

There is too much information

“I have to say I’m astonished by the amount of the text that they put in here. It’s just, it’s just bad. I don’t want to read. I -Participant 6

6 of 7 participants mentioned this

The timeline of projects is unclear

“I’m still confused what the projects are going to be.” -Participant 2

4 of 7 participants mentioned this

Much of the information is irrelevant to most participants

“I don’t want to spend any more time than I have to to find the information I need. I want them to anticipate what I need.” -Participant 2

3 of 7 participants mentioned this
Recommendations

Show a timeline of major projects

Customizable filters

Resources should be “succinct and upfront” (Particpant 2)

Current Traffic Page

Participants struggled to understand every aspect of this page

The separation into inbound and outbound was not deemed useful, but confusing. Also, all seven of the participants attempted to interact with the map in some way and were frustrated when they were unable to.

All participants mentioned this

The information presented on this page is exclusively relevant to cars.

Commuters utilizing other means of transportation found nothing of interest on this page

All participants mentioned this

The map is missing several neighborhoods

Large portions of the city are not covered by the map

All participants mentioned this
Recommendations

Remove this page. Its exclusivity to drivers actively works against the goal of changing commuter behavior by getting more cars off the road. As one user said, “This Current Traffic thing really is oriented toward people who are driving” (P7).

Long-Term Commute Planning

Since SDOT was more interested in how useful this website would be for planning their commute for the next few months rather than planning their commute today, we wanted to point out one of the questions that we asked participants after they had completed tasks on the website.

Limitations and Discussion

All experiments have constraints, and there were a number of areas where we could have expanded our research if there had been more time or a greater project scope.

  • We were unable to study site usage over a long period of time as each participant was exposed to the website for the first time in our session, and given only an hour to complete their tasks.

  • Participants were not given much time to investigate the content-heavy areas of the site, such as the blog. Many found this resource useful after a cursory perusal of the information, but a deeper dive would be valuable

  • It was also outside of our scope to have users evaluate external links and apps that are featured on the site. Much of the actual tasks users will seek to complete through the Seattle Traffic site require a visit to these tools that aid in both long- and short-term commute planning

  • No full-time car drivers participated in our study, so our study results are not necessarily representative of the experience of these type of commuters.